Usage data
Last updated: May-01-2026
There are a few locations in the Cloudinary Console where you can view statistics, graphs, and other important information about your account usage. In addition, you can receive account usage information via an email notification.
Dashboard
You can view summary details and trend graphs of your overall account usage, as well as for your selected product environment. This includes transformations, total assets, used storage, and used bandwidth. You can also view all add-ons you've registered to, and your current plan and usage on each.
Find this information just below the Product Environment section in Home > Dashboard.
The following sections describe the data available on your Dashboard and how you can leverage that information.
Plan Current Usage
View the current plan for your account and its credit details, including your monthly bandwidth, storage, and transformation quota. See how much of your month's credit you've already used up to help you plan the rest of the month's activities, or to decide to upgrade your plan, which you can also do here.
Usage Overview
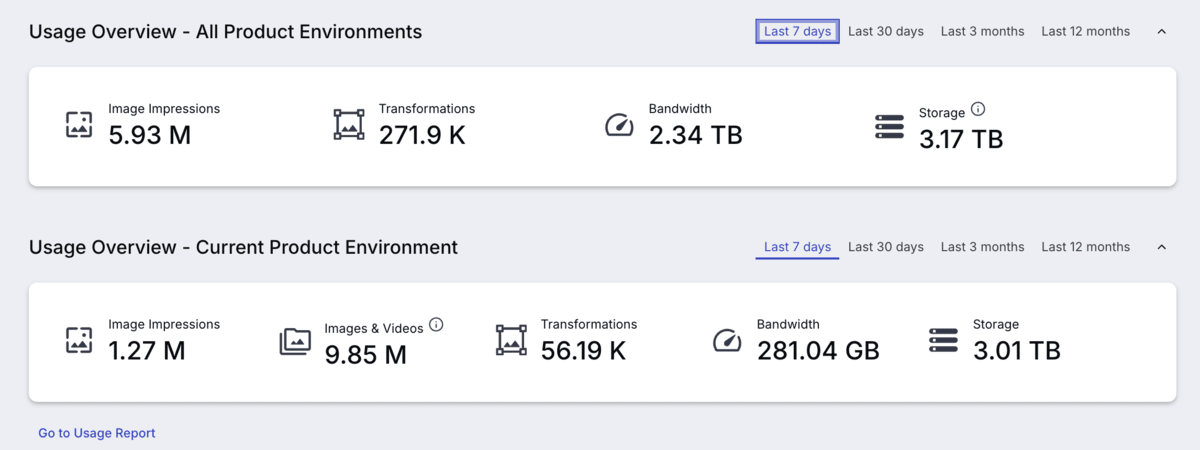
Get a basic overview of the image impressions, transformations, bandwidth, and storage you've used across your account and for the selected product environment.
Click the Go to Usage Report link below the Usage Overview to jump to the detailed breakdowns and trend charts for each of these usage metrics.
Error Summary
See how your errors are distributed across the different error types during a selected period of time within your selected product environment. Use this information to alert you to problem areas that you should focus on.
For example, if you have a disproportionately large number of 401 - Unauthorized errors, you might choose to check why your system is experiencing so many unauthorized attempts.
Click the Go to Error Reporting link below the Error Summary to jump to a report showing the errors graphed over time. You can also see all the errors that were reported on a specific date, which can also help you pinpoint problem areas.
Reports
Usage Reports
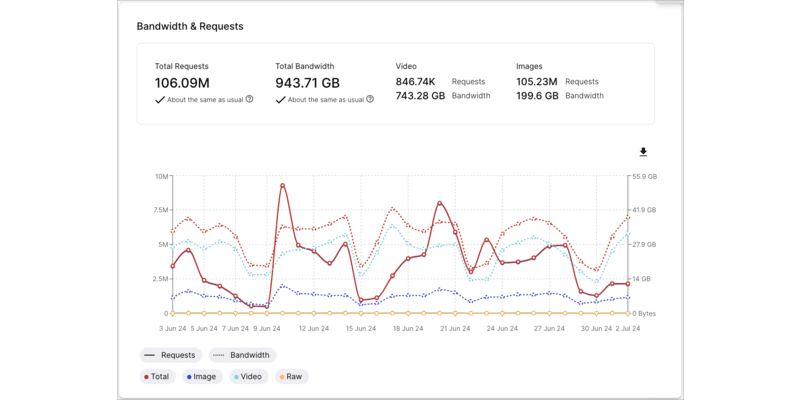
Check how many image impressions, delivered video seconds, transformations, bandwidth, and storage you've used over a selected period of time.
To view your usage reports, navigate to Home > Usage Reports. The page includes usage reports for:
- Your entire account:

- The currently selected product environment:

Data for your product environment is presented on a more granular level and usage is presented per asset type. You can view the data for different time ranges, and for many of the charts, you can also filter by asset type. For example, you can see how many of your total transformations consisted of images or videos.
Delivery Reports
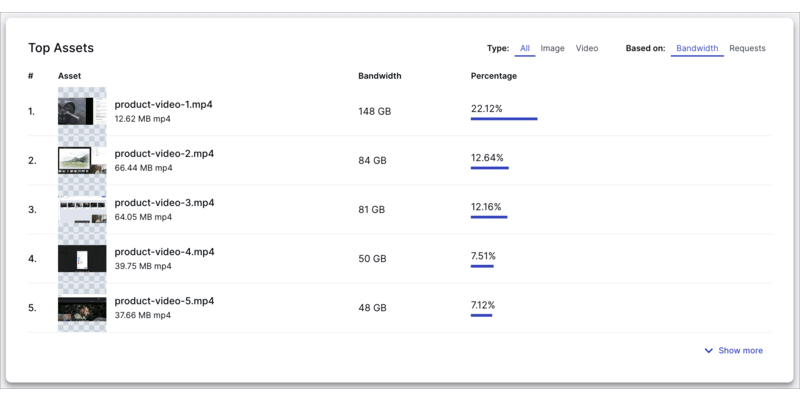
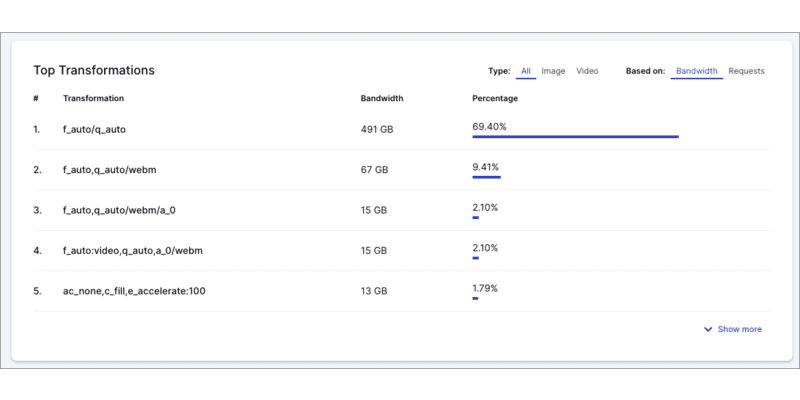
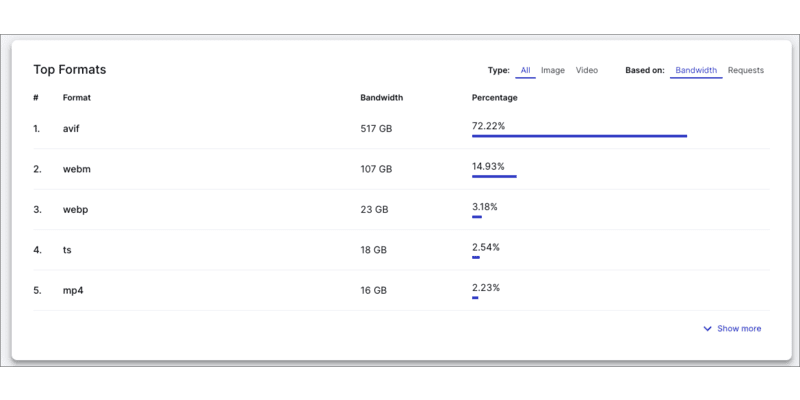
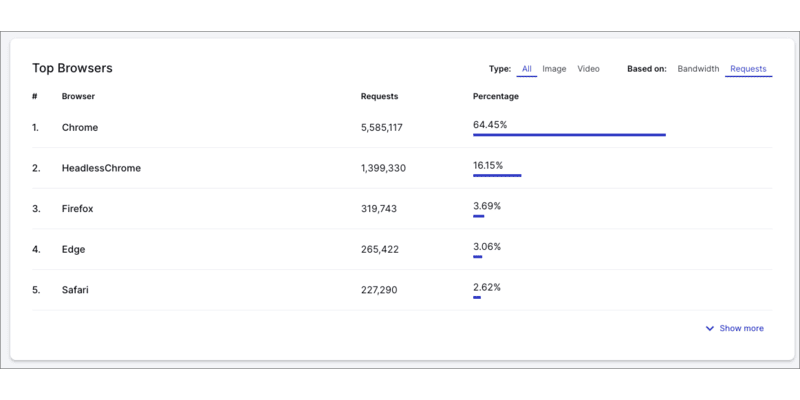
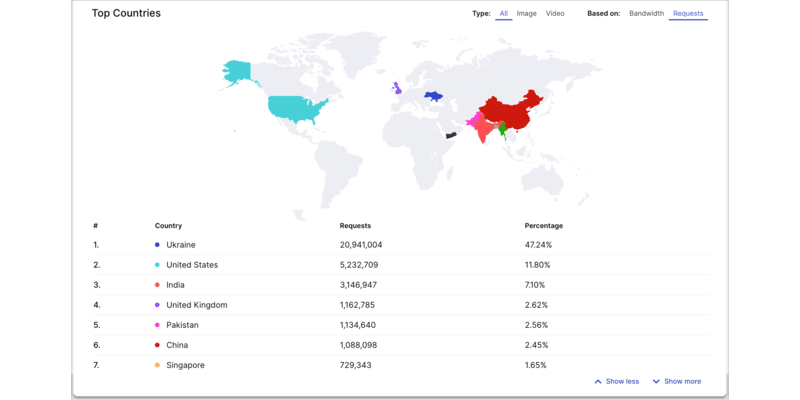
The Delivery Reports page has a large variety of usage details that can help you to analyze how your users are interacting with your published asset within your selected product environment.
To view your delivery reports, navigate to Home > Delivery Reports:
The images below show just a few of the items provided in the report:
Referral and browser reports
The Top Referral Domains and Top Referral Pages reports show where requests for your assets originated. The Top Browsers report is based on the HTTP User-Agent header, which identifies the browser or software that made the request.
If you see N/A listed as a top referrer in either report, it means those requests arrived without a value in the HTTP Referer header, making it difficult to determine their origin. This can complicate investigations into bandwidth spikes or unoptimized assets.
To improve referral attribution, set the Referrer-Policy header appropriately (for example, no-referrer-when-downgrade) on your site or application.
Common reasons for "N/A" values
Requests without Referer or User-Agent headers commonly originate from:
- Native mobile applications (iOS / Android), which often omit these headers
- Proxy servers or caching intermediaries
- Command-line or automation tools such as
curlorwget - Sync or import processes (for example, CMS or product catalog integrations)
- Social media platforms fetching assets for previews or thumbnails
- Users opening asset URLs directly (for example, via a new browser tab)
- Browser privacy extensions or settings that block referrer information
- Custom or restrictive
Referrer-Policysettings (for example,no-referrerorsame-origin)
Domain-level vs. page-level referral data
In some cases, a referral domain is reported, but the Top Referral Pages report shows only the root domain instead of the full page path.
This usually occurs due to the site's configured Referrer-Policy, such as:
originstrict-originstrict-origin-when-cross-origin
These policies limit the amount of URL information sent in the Referer header, preventing page-level attribution.
Best practices to reduce "N/A" values
- Where possible, configure native mobile apps to send
RefererandUser-Agentheaders - Review and adjust your site's
Referrer-Policyif page-level referral data is required - Be aware that some request sources (such as proxies or third-party services) inherently omit these headers
Error reports
The Error report shows you any errors generated from API calls or delivery URL requests to your selected product environment.
To view your error reports, navigate to Home > Error Reports.
You can export an error report for a specific day by selecting the date and clicking the Export to CSV link. You'll get an email with a link to download the error report in CSV format.
Video Analytics
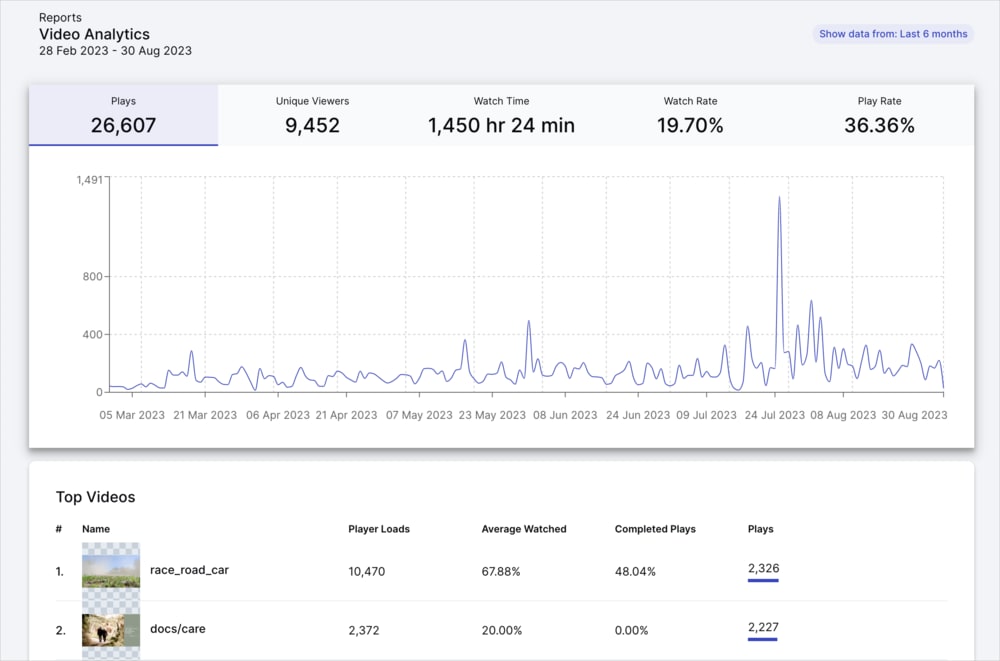
Use Video Analytics to understand and optimize your video content served by Cloudinary. The metrics are automatically collected for all videos delivered through the Cloudinary Video Player from your selected product environment.
1.9.9.You can access the analytics by opening the Video sub-menu and selecting Analytics. Here, you will be presented with a set of metrics and graphs that show how your video content has been delivered.
Learn more about Video Analytics and how to use them.
Usage limits and notifications
You can easily view the limits of the current plan for your account, upgrade to a new plan, and choose to receive notifications about your usage.
Usage limits
To view your current plan limits, click the Settings icon in the Console Options sidebar and select the Account page.
To view your current plan or upgrade, go to the Plan Details page in the Console Settings. You'll also see how much of your monthly quota you've used, displayed as both a percentage and as actual usage.
Behavior when exceeding plan limits
Cloudinary plans use soft usage limits, which means that exceeding 100% of your plan quota does not result in immediate service interruption.
Notifications and alerts
When your account usage approaches approximately 90% of a quota:
- Usage warnings are displayed in the Cloudinary Console.
- Email notifications are sent to account administrators or the configured billing email address.
These alerts are intended to give you time to take action before reaching or exceeding your plan limits.
Rolling 30-day usage calculation
Usage is calculated on a rolling 30-day basis.
As a result, usage that exceeds a quota may naturally decrease over time if earlier activity falls outside the rolling window.
Fixed plans
If you are on a fixed plan and your usage exceeds 100% of your quota:
- You will be prompted to upgrade your plan or reduce usage.
- If usage remains above the quota after repeated notifications, your account may be automatically disabled.
When an account is disabled due to overuse:
- Updates to assets are blocked, including uploads and generating new transformed assets.
- Asset delivery may continue temporarily, but delivery can also be blocked if the account remains disabled.
Pay-as-you-go plans
If you are on a pay-as-you-go plan and your usage exceeds the plan quota:
- Usage above the quota is billed as overage.
- Overage charges are applied on your regular billing date rather than triggering immediate blocking.
Usage notifications
To receive monthly account usage reports by email, select the account usage report option in your Console Settings under My Profile > Email Preferences.
You will receive a notification when your usage reaches 90% and again when you've reached your allotted usage.
Users on an Enterprise plan can also opt to be notified when account usage exceeds a specified percentage threshold.
Assets usage data
You can view your Assets usage data by generating Activity Reports.
To generate an Activity Report, select Assets from the Product Selector located at the top left of your Console, and select Activity Reports from the Product Navigation menu.
The Activity Reports include:
- All account management activities performed in Assets, for example user management and product environment management actions.
- All actions performed on tracking-enabled product environments in Assets, for example uploading and deleting assets, updating metadata, adding assets to collections, etc.
To access your Assets Activity Reports, from the Product Selector located on the top left of the Console, switch to the Assets proiduct and select Activity Reports from the Product Navigation menu.
For more information, see Assets usage data.
 Ask AI

