Assets Reports
Last updated: Feb-09-2026
- Assets Reports is a premium feature for Assets Enterprise plans, and its availability depends on your account setup. If it isn't yet enabled for your account and you want to enable it, please contact your Customer Success Manager.
- Some accounts may have the Assets Dashboard instead of Assets Reports.
- These features aren't included in the Media Library available with the Assets Free plan, which offers basic management.
- To learn more about the features available in the Assets Free plan and how they can support development workflows, see Media Library for Developers.
- For upgrade options or more information, contact us.
Assets Reports provide comprehensive analytics and insights into how your team uses the Media Library, an essential part of Cloudinary Asset's Digital Asset Management (DAM) platform. These reports help you track user engagement, understand search behavior, identify your most-downloaded assets, and monitor how teams collaborate through collections, all within a specific product environment.
They show trends over time, as well as detailed metrics for the listed month, displayed at the top of the page. Data updates monthly, so the reports show the previous completed month's data. Activity from the current month won't appear until the following month.
This makes it easy to see which reporting period each view represents.
Use cases and value
Assets Reports enable you to:
- Optimize asset organization: Identify which assets and collections are most frequently accessed to inform your taxonomy and folder structure decisions.
- Understand user behavior: Track how team members interact with your Media Library to improve workflows and identify training needs.
- Measure adoption: Monitor engagement trends over time to gauge platform adoption and ROI.
- Improve searchability: Analyze search patterns and commonly used filters to enhance metadata strategies and tagging conventions.
- Track content usage: See which assets are downloaded most frequently to understand content performance and priorities.
- Enhance collaboration: Monitor collection creation and sharing to understand how teams collaborate around assets.
Summary information
At the top of the Assets Reports page, you'll find summary information about the listed month. This provides a quick overview of how your assets were managed in the Media Library. Metrics include:
Active Users: The number of users who searched, downloaded, and uploaded in the Media Library.
Uploads: The number of uploads that were performed during the month, including single asset and bulk uploads.
Searches: The number of searches performed in the Media Library, including Advanced Search filters, free text, Query Builder expressions, and Visual Search.
Downloads: The number of assets downloaded during the month. This metric includes single asset downloads and may include bulk downloads depending on your setup (contact your Customer Success Manager for specifics).
Collections Viewed: The number of times during the month that publicly shared collections were viewed.
Each metric also shows the change from the previous month, so you can monitor changes in your activity.
The Engagement report
The Engagement report shows you how actively your team uses the Media Library, helping you understand user participation and platform adoption.
Most Active Users
Understanding who your power users are helps you identify platform champions who can mentor others, provide valuable feedback on new features, and validate your Media Library strategy. These users have developed efficient workflows and deep knowledge of your asset organization. Leverage their expertise to improve adoption across your team.
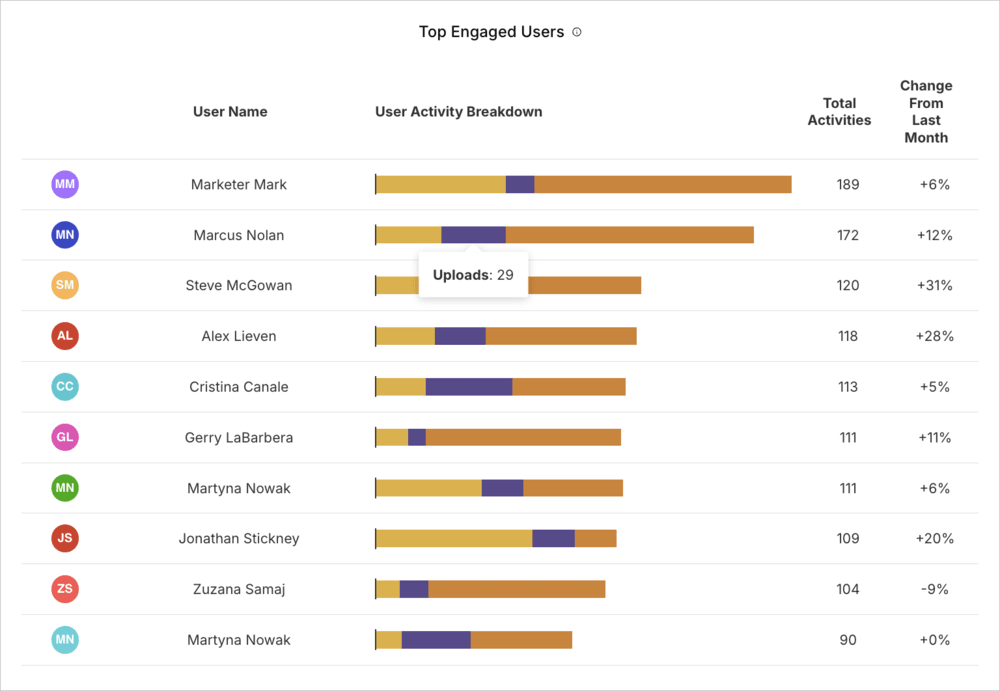
Top Engaged Users
Shows the users who have performed the most actions in the Media Library during the listed month, with activity broken down into searches, downloads, and uploads. This metric helps identify your power users and potential platform champions.
Engagement Trends
Tracking engagement patterns over time reveals whether your Media Library is becoming more integral to daily workflows or losing relevance. These trends help you measure the impact of training initiatives, feature releases, and organizational changes, while also surfacing early warning signs of declining adoption that might indicate technical issues, workflow friction, or unmet user needs.
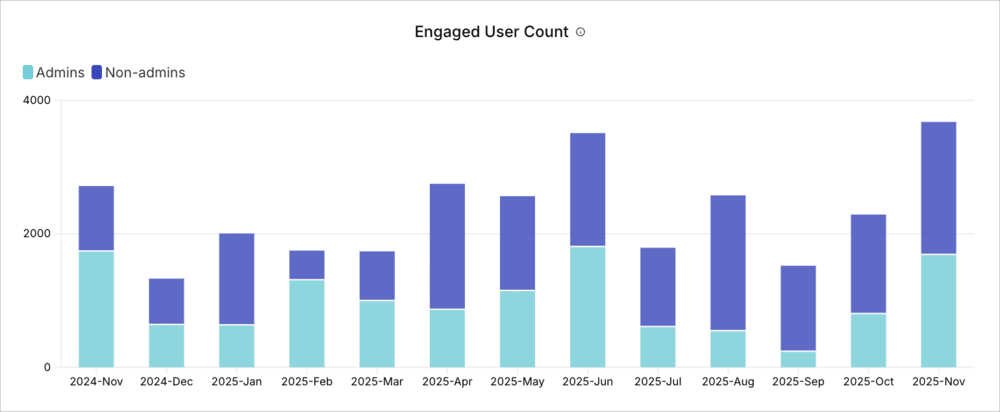
Engaged User Count
Shows the number of unique users who actively used the Media Library each month over the past 12 months.
Active Media Library Sessions
Shows the number of distinct sessions in the Media Library each month over the past 12 months. A session represents each time a user logs in and actively works in the Media Library until they log out or their session expires.
The Search report
The Search report reveals how users find assets in your Media Library, helping you optimize metadata, tags, and search configurations.
Top Searches
What users search for reveals their actual needs and how they think about finding content. This is often different from how administrators organize it. These queries show which asset types, campaigns, or projects matter most to your team's daily work, and highlight gaps where naming conventions or metadata might not align with user expectations.
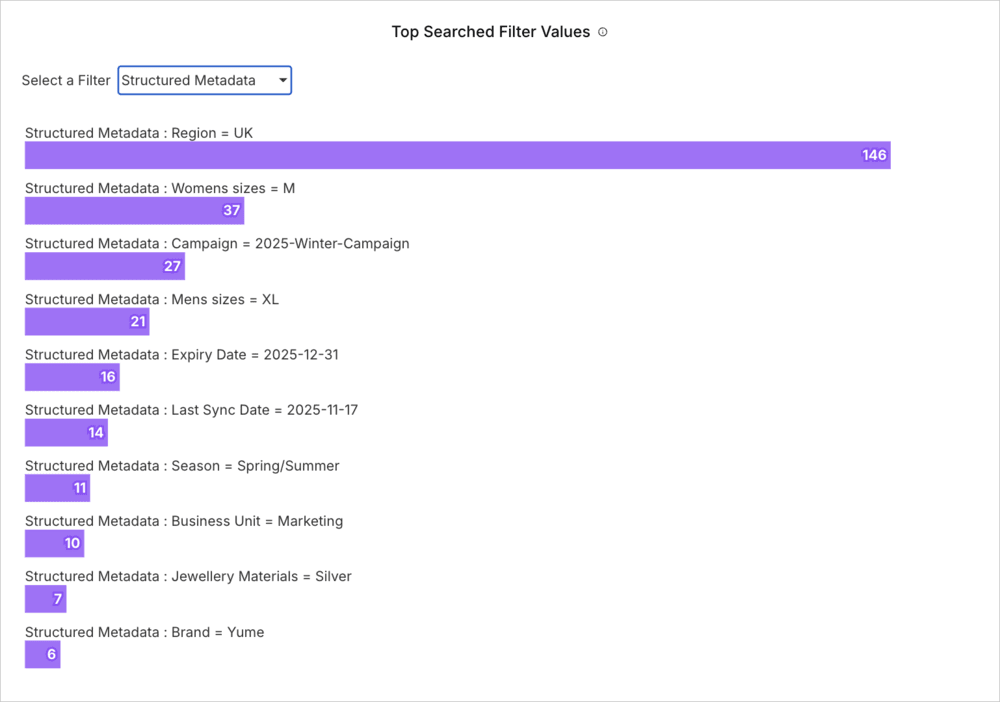
Top Searched Filter Values
Shows which specific filter values (such as tags, folder names, or structured metadata values) were most commonly used to narrow search results during the listed month.
By default, this metric displays the top values across all filter types combined. For example, the top results might include "available" (from the rights_management metadata field), "jpg" (from the format filter), and "Thanksgiving campaign" (from tags). You can drill down by selecting a specific filter type, such as Structured Metadata or Display Name to see the most-used values within that category.
Top Search Expressions
Shows the most popular complex search queries that combine multiple criteria during the listed month.
Search Trends
Tracking search patterns over time helps you anticipate resource needs, understand seasonal variations in content demand, and correlate activity spikes with campaigns or project launches. This temporal view reveals when your team needs the most support and whether search behavior changes after training sessions or new feature releases.
Total Searches
Shows the total number of searches performed each month over the past 12 months. This includes duplicate searches (the same search performed multiple times).
Total Users Who Performed Searches
Shows the number of unique users who performed searches each month over the past 12 months, indicating search feature adoption.
Visual Search
Visual and Natural Language Search (referred to as Visual Search) is a powerful way to find assets. It understands context and visual meaning, whether from text or image input, to deliver more intuitive and accurate results than traditional keyword or tag-based search.
Understanding which reference images users rely on and what terms they pair with visual searches reveals how your team conceptualizes and categorizes visual content. These insights help you acquire assets that match proven visual patterns while ensuring your metadata captures the language users naturally associate with specific visual styles, compositions, or subjects.
Images Used in Similarity Search (Coming Soon)
This metric will list the images most frequently used as references for finding visually similar assets using Visual Search during the listed month.
Top Terms Used in Visual Search
Shows the most common natural language queries used in Visual Search during the listed month.
The Downloads report
The Downloads report helps you understand which assets are most valuable to your team and track content distribution.
Top Downloaded Assets
Your most-downloaded assets represent the content that drives real business value. These are the images, videos, and documents your team relies on for production work. Understanding which assets see the most use helps you prioritize quality control, identify candidates for updates or versioning, and recognize patterns in what makes content valuable enough to download repeatedly.
Top Media Library Downloads
Shows overall download activity across the Media Library during the listed month, excluding bulk downloads such as folder downloads.
Download Trends
Monitoring download patterns over time reveals how content consumption evolves across your organization. These temporal insights help you anticipate peak demand periods, identify seasonal content needs, and understand whether your Media Library is growing more or less essential to daily operations. Tracking unique versus total downloads and user participation shows not just what content matters, but how deeply teams rely on the Media Library for their production workflows.
Unique Assets Downloaded
Shows the number of distinct assets downloaded at least once each month over the past 12 months.
Total Assets Downloaded
Shows the total number of download actions each month over the past 12 months, including multiple downloads of the same asset.
Total Users Who Downloaded
Shows the number of unique users who downloaded assets each month over the past 12 months.
The Collections report
The Collections report provides insights into how your team organizes and shares groups of assets, and how external stakeholders engage with them.
Most Popular Public Collections
Public collections serve as curated sets of assets shared with external stakeholders, partners, or clients via public links. Understanding which collections generate the most views and downloads reveals what content themes resonate with your audience and helps you prioritize future curation efforts.
Top Viewed Public Collections
Lists public collections by view count during the listed month, showing which collections attract the most interest.
Top Downloaded Public Collections
Ranks public collections by download frequency during the listed month, indicating which collections contain the most useful assets.
Public Collection Trends
Tracking overall collection activity over time reveals how external stakeholders engage with your shared content. These trends help you understand whether public collections are growing in value to your audience and guide decisions about where to focus curation efforts.
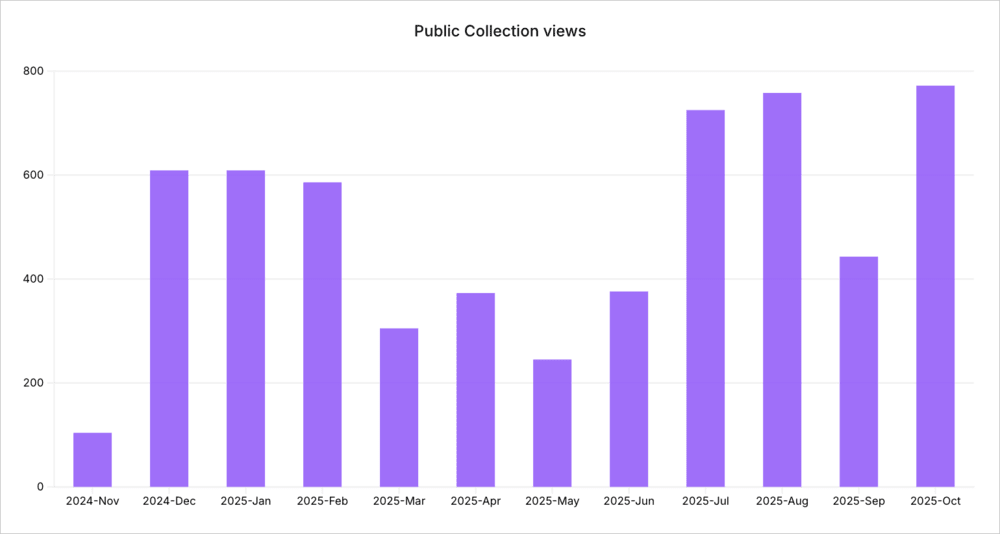
Public Collection Views
Shows the number of times public collections were viewed each month over the past 12 months.
Public Collection Downloads
Shows the number of downloads from public collections each month over the past 12 months, broken down by original asset downloads and downloads with transformation presets applied (such as watermarked or resized versions).
High transformed download rates may indicate your transformation presets (watermarks, sizing) are meeting stakeholder needs, while high original download rates might suggest a need to create or adjust presets to better protect assets or optimize file sizes for specific use cases.
Collection Creation
Collection creation patterns show how your team groups and organizes assets for different projects and campaigns. When users actively create collections, it means they're finding the feature useful for their workflows.
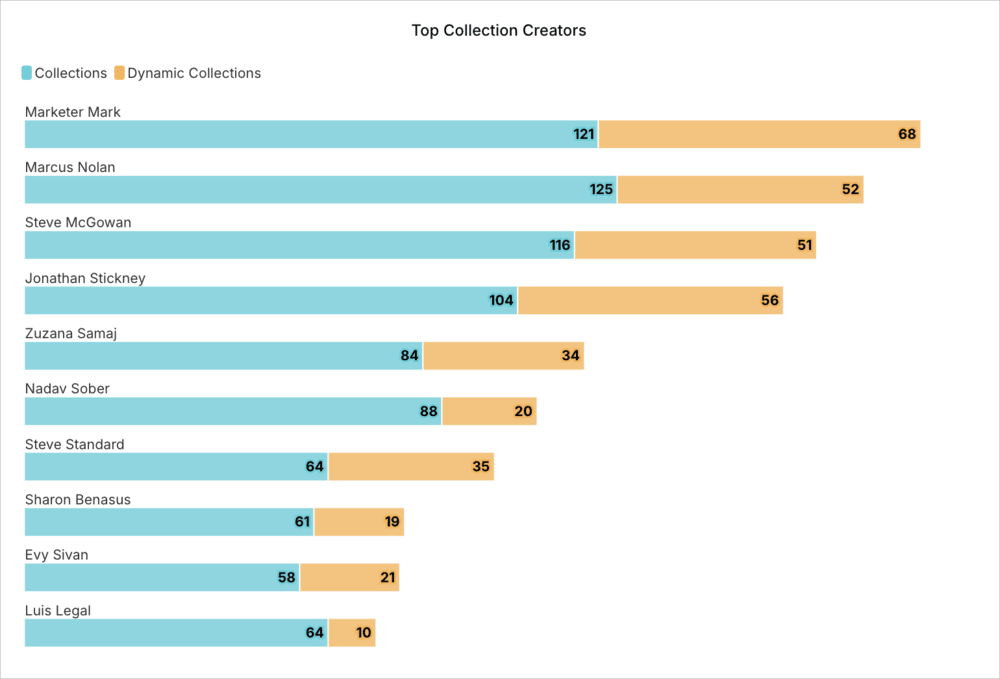
Top Collection Creators
Identifies users who created the most collections during the listed month, highlighting curators and organizational leaders on your team.
The chart breaks down collection creation into two types:
- Collections: Standard collections with manually selected assets.
- Dynamic: Dynamic collections that automatically include assets matching specific filter criteria (such as a structured metadata field value).
Collection Creation Trends
Shows the number of collections created each month over the past 12 months.
 Ask AI


